Click: My Primary Kubernetes Tool
Wed Aug 25 2021
Click has made my Kubernetes experience a pleasure. I adopted Click after joining Databricks because using kubectl was too inconvenient. There aren't many articles or blog posts discussing Click, so I decided to write one in hopes of convincing you to try it out.
What is Click
Click is a Kubernetes REPL that lets you explore resources in your Kubernetes cluster and concisely run multiple commands against a selected resource. Resource selection lets you avoid the text editing and copy-pasting typically required to craft your desired kubectl command. Click commands are also terse by design so you can focus on issuing commands instead of dealing with syntax.
Alternatives to Click
Before stumbling upon Click, I had tried other solutions like creating Bash aliases and functions. Unfortunately these custom solutions were brittle and took lots of time to create and maintain. K9s is actually a pretty solid alternative to Click and I'd recommend checking it out if you're looking for a more advanced tool. Now that we've discussed the alternatives, let's explore how Click can help us work more efficiently.
A Real-World Example with Click
Consider a real-world scenario where you have an existing Kubernetes cluster and want to launch a new nginx Deployment on it. The typical checklist to accomplish this is:
- Create the Deployment
- Ensure the Deployment's pods are healthy
- Check the pod logs for stack traces
As per step 1, lets run kubectl apply to create a Deployment in the default namespace. We need to use kubectl for this because Click can't directly create new resources yet:
kubectl apply -f https://k8s.io/examples/controllers/nginx-deployment.yaml --namespace default
For step 2, fire up Click by typing click in your terminal. Click operates by reading your local Kubeconfig file, so it doesn't require any additional setup. Notice that Click automatically selects the Kubernetes context demo-cluster and namespace default from my previous Click session. The prompt displays none at the end because we haven't selected a pod yet.
~ click ✔ 49s 01:00:06 PM
[demo-cluster] [default] [none] >
Type deployments to see the existing deployments in our currently selected default namespace:
[demo-cluster] [default] [none] > deployments
NAME               READY   UP-TO-DATE   AVAILABLE   AGE
nginx-deployment   2/3     3            2           103s
[demo-cluster] [default] [none] >
Hmm thats odd. Only 2 of the 3 pods are ready. Let's type pods to dig deeper:
[demo-cluster] [default] [none] > pods
 ####  Name                               Ready    Phase    Age     Restarts
-----------------------------------------------------------------------------
    0  nginx-deployment-66b6c48dd5-72mc5  1/1      Running  3m 27s  0
    1  nginx-deployment-66b6c48dd5-nplcc  Unknown  Pending  3m 27s  0
    2  nginx-deployment-66b6c48dd5-zdc87  1/1      Running  3m 27s  0
-----------------------------------------------------------------------------
[demo-cluster] [default] [none] >
Pod #1 isn't running yet so lets inspect what's going on by entering 1 and then typing events to view the pod 1 events. Notice that after typing 1, the command prompt will continue to remember the selected pod is nginx-deployment-66b6c48dd5-nplcc.
[demo-cluster] [default] [none] > 1
[demo-cluster] [default] [nginx-deployment-66b6c48dd5-nplcc] > events
2021-08-17 13:18:11 -07:00 - 0/2 nodes are available: 2 Too many pods.
 count: 9
 reason: FailedScheduling

[demo-cluster] [default] [nginx-deployment-66b6c48dd5-nplcc] >
Aha! So there aren't enough nodes in the Kubernetes cluster to schedule all the pods in our Deployment. Let's quickly view the list of nodes in the cluster by typing in nodes. The output of this command is dependent on the selected context and not the selected namespace or pod. This is because nodes are a context-level resource in Kubernetes.
[demo-cluster] [default] [nginx-deployment-66b6c48dd5-nplcc] > nodes
 ####  Name                                        State  Age
-----------------------------------------------------------------
    0  ip-172-31-30-75.us-west-2.compute.internal  Ready  2d 19h
    1  ip-172-31-51-26.us-west-2.compute.internal  Ready  1d 8h
-----------------------------------------------------------------
[demo-cluster] [default] [nginx-deployment-66b6c48dd5-nplcc] >
To fix the error we saw above, I'm going to go to increase the size of my EKS cluster Node Group from 2→3 nodes:
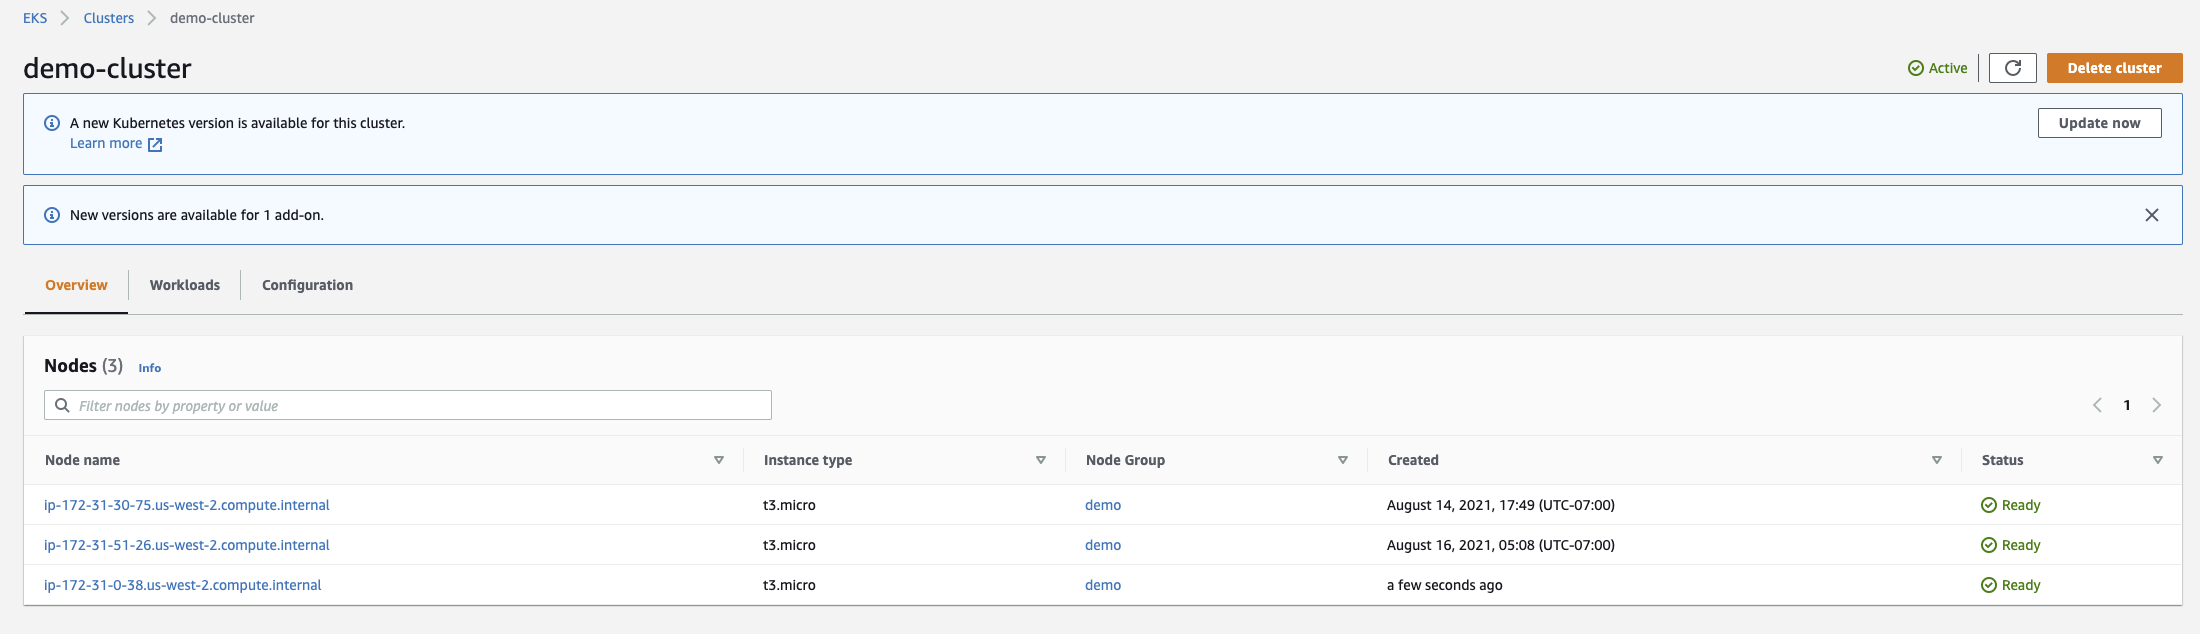
Now let's verify the new node shows up in Click:
[demo-cluster] [default] [nginx-deployment-66b6c48dd5-nplcc] > nodes
 ####  Name                                        State  Age
-----------------------------------------------------------------
    0  ip-172-31-0-38.us-west-2.compute.internal   Ready  1m 3s
    1  ip-172-31-30-75.us-west-2.compute.internal  Ready  2d 19h
    2  ip-172-31-51-26.us-west-2.compute.internal  Ready  1d 8h
-----------------------------------------------------------------
[demo-cluster] [default] [nginx-deployment-66b6c48dd5-nplcc] >
And now finally we should see all 3 pods scheduled and healthy:
[demo-cluster] [default] [nginx-deployment-66b6c48dd5-nplcc] > pods
 ####  Name                               Ready  Phase    Age      Restarts
----------------------------------------------------------------------------
    0  nginx-deployment-66b6c48dd5-72mc5  1/1    Running  21m 23s  0
    1  nginx-deployment-66b6c48dd5-nplcc  1/1    Running  21m 23s  0
    2  nginx-deployment-66b6c48dd5-zdc87  1/1    Running  21m 23s  0
----------------------------------------------------------------------------
[demo-cluster] [default] [nginx-deployment-66b6c48dd5-nplcc] >
Now let's check the pod 1 service logs to make sure there are no stack traces. In this example, our nginx containers don't actually log anything so the pod logs are empty.
[demo-cluster] [default] [nginx-deployment-66b6c48dd5-nplcc] > logs
[demo-cluster] [default] [nginx-deployment-66b6c48dd5-nplcc] >
As a summary, here are all the inputs we've entered so far:
kubectl apply -f https://k8s.io/examples/controllers/nginx-deployment.yaml --namespace default
click
deployments
pods
1
events
nodes
nodes
pods
logs
The kubectl Way
Below are the commands needed to perform the same investigation using kubectl. In my experience these commands also require more Googling and error-checking.
kubectl apply -f https://k8s.io/examples/controllers/nginx-deployment.yaml --namespace default
kubectl config use-context demo-cluster
kubectl config current-context # I always do this to make sure I don't nuke prod
kubectl get deployments --namespace default
kubectl get pods --namespace default
kubectl describe pod nginx-deployment-66b6c48dd5-nplcc --namespace default
kubectl get nodes
kubectl get nodes
kubectl get pods --namespace default
kubectl logs nginx-deployment-66b6c48dd5-nplcc --namespace default
More Cool Things about Click
Bash Interoperability
You can pipe the output of any Click command into any bash command. I often use this to search a selected pod's service logs using logs | less so I could search logs quickly without leaving Click.
Aliases for Selected Resources
If you often run the same Click command for selected resources, it's helpful to use a shorter Click alias instead. For example, I'd often need to SSH into a selected pod using exec bash -i. Even this command was too long for my taste and I'd occasionally forget it. So I created an ssh alias and haven't had a hiccup since. See below:
[demo-cluster] [default] [nginx-deployment-66b6c48dd5-nplcc] > alias ssh 'exec bash -i'
aliased ssh = 'exec bash -i'
[demo-cluster] [default] [nginx-deployment-66b6c48dd5-nplcc] > ssh
root@nginx-deployment-66b6c48dd5-nplcc:/#
Great man pages
Click has extremely good documentation and you can view it all from the REPL. There hasn't been a single time I've needed to Google how to do something in Click. I just type help to see all the possible Click commands. Each command also has its own man page.
What Click is Not
Click isn't a replacement for kubectl and there are definitely certain scenarios where kubectl is the better tool for the job. For example, if you want to create scripts you should definitely use kubectl because Click is an interactive tool. There also isn't a good way to automatically refresh output in Click, which is useful when you want to verify a state change you've just made. For these cases, I usually tack a watch before my kubectl command.
Click is also isn't a replacement for a Kubernetes UI. If you want a UI-only tool, Kubernetes Dashboard does this pretty well.
What's Next?
I am passionate about dev tools and I enjoy writing about the optimizations and workflow improvements I've encountered during my career. I'll continue to share tools, tips, and hacks in my next few blog posts. If you find my content interesting and want to hear more, check me out on Twitter.